
Table of Contents
- How to Calculate Conversion Rate (And What the Numbers Mean)
- Why Most Website Conversion Rates Stay Stuck at 2%
- Conversion Rate Optimization Best Practices That Actually Move the Needle
- Landing Page Optimization Tips That Top Performers Use
- A/B Testing Tools for Small Business: How to Test Without Wasting Time
- AI-Driven Personalization and the New Conversion Frontier
- How to Improve Website Conversion Rates: A Prioritized Action Plan
- Conclusion
Last Updated: August 18, 2026
How to Calculate Conversion Rate (And What the Numbers Mean)
Conversion rate is the percentage of website visitors who complete a desired action, calculated by dividing the number of conversions by total visitors and multiplying by 100. If 1,000 people visit your site and 25 buy something, your conversion rate is 2.5%.
According to Digital Applied’s Conversion Rate Benchmarks 2026, the median website conversion rate sits at 2.35%, but top performers reach 11.45%. That gap is not luck, it is the direct result of systematic optimization. The difference between a 2% and a 5% conversion rate on the same traffic volume can double your revenue without spending another dollar on ads.
Understanding which conversions to measure is critical. Macro-conversions are primary goals: purchases, form submissions, booked calls. Micro-conversions are the steps along the way: email sign-ups, video plays, page scroll depth. Tracking both gives you a complete picture of your sales funnel health.
| Conversion Type | Example | Why It Matters |
|---|---|---|
| Macro-conversion | Product purchase, demo request | Direct revenue impact |
| Micro-conversion | Email sign-up, add to cart | Funnel health indicator |
| Negative signal | Bounce, cart abandonment | Identifies friction points |
| Engagement signal | Time on page, scroll depth | Measures content relevance |
Why Most Website Conversion Rates Stay Stuck at 2%
Most businesses treat their website as a finished product rather than a living system. According to Invesp’s CRO research, for every $92 spent acquiring a customer, businesses spend only $1 on converting them. Teams pour budget into paid traffic, then send those visitors to pages that were never built to convert. The average conversion rate across fourteen industries hovers at 3.3%, and most small business sites sit well below that.

Companies with a formal conversion rate optimization process are twice as likely to see a significant increase in sales. Businesses stuck at 2% are usually testing nothing, measuring nothing, and changing things based on gut feel.
The Mobile-Desktop Gap Is Getting Worse
Mobile accounts for 65% of all website traffic but converts at only 1.82%, compared to 3.14% on desktop (Digital Applied, 2026). That gap has widened from 38% in 2024 to 42% in 2026, driven primarily by checkout friction and poor payment integration on smaller screens. If you have not audited your mobile checkout experience in the last six months, you are likely leaving conversions on the table.
Page Speed: The Silent Conversion Killer
A 1-second delay in page load time reduces conversion rates by up to 7%. Moving load time from one to three seconds raises the probability of a mobile bounce by 32% (Google, July 2026). Speed is a direct revenue lever. Run your site through Google’s PageSpeed Insights. If your score is below 70 on mobile, fixing that single issue will outperform almost any other optimization you could run this month.
Do not wait until a site rebuild to address page speed. Uncompressed images, unused JavaScript, and slow hosting are often fixable without a full redesign.
Conversion Rate Optimization Best Practices That Actually Move the Needle
The highest-impact conversion rate optimization best practices depend on where your funnel is currently breaking. Start with analytics and heatmaps. Session recordings and heatmap tools show you exactly where visitors click, scroll, and abandon, so you are not guessing.
"Conversion Rate Optimization is the art and science of getting people to act once they arrive on your website."
— Tim Ash, CEO at SiteTuners (Howuku, 2023)
Reduce Friction in Your Checkout Flow and Forms
Forms with fewer fields outperform longer forms by 25-40%. Every additional field is a micro-decision that costs you completions. Remove every field that is not essential to process the transaction or qualify the lead. Break long forms into multi-step sequences with a progress indicator, add real-time inline validation, and pre-fill fields where possible.
Venture Harbour implemented multi-step forms and used form analytics to identify friction points. Their enquiry form conversion rate climbed from 0.96% to 8.1%, a 743% improvement. That result came from removing obstacles, not adding features.
Audit your form completion rate separately from your page conversion rate. A page with strong traffic but a 20% form completion rate means the page is working; the form is broken.
Trust Signals, Social Proof, and Psychological Triggers
Trust signals are the fastest way to close the gap between visitor intent and completed action. Effective social proof is specific and proximate to the conversion point: customer reviews on product pages, real testimonials with names and photos near CTAs, and visible purchase counts all reduce psychological risk.
Urgency messaging, including limited-time offers and countdown timers, boosts conversions by 332% (July 2026 playbook). Express Watches tested a "badge of authenticity" against a "lowest price guarantee" and increased online sales by 107% by leaning into authenticity. What you emphasize matters as much as whether you have a badge at all.
Landing Page Optimization Tips That Top Performers Use
The biggest mistake with landing pages is treating them as brochures. A landing page has one job: move a specific visitor segment to a specific next action. Top-performing landing pages share a clear structure: a headline that matches the traffic source, a subheadline that reinforces value, a single primary CTA above the fold, and social proof within the first scroll. According to [eDesign Interactive’s 2026 Web Design(/2026/08/affordable-ecommerce-web-design-services/) and UX Trends report | edesigninteractive.com], well-designed UX can increase conversions by up to 400%.
Value Proposition and CTA Clarity
Your value proposition answers three questions in under five seconds: what you offer, who it is for, and why it is better than the alternative. If a first-time visitor cannot answer those without scrolling, your conversion rate is suffering.
CTA language matters significantly. "Get Started" is weaker than "Start My Free Audit." Use first-person language that describes what the visitor gets. Personalized CTAs convert up to 202% higher than generic versions (EntreResource, 2026).
The single most impactful landing page change most small business sites can make is rewriting their headline to match the specific intent of the traffic source.
A/B Testing Tools for Small Business: How to Test Without Wasting Time
A/B testing fails when teams run tests without enough traffic to reach statistical significance, stop tests early, or test multiple variables at once. Convertcart observed a 37% win rate across 1,103 client experiments, meaning 63% of tests did not produce a winning variation. That is how experimentation works.
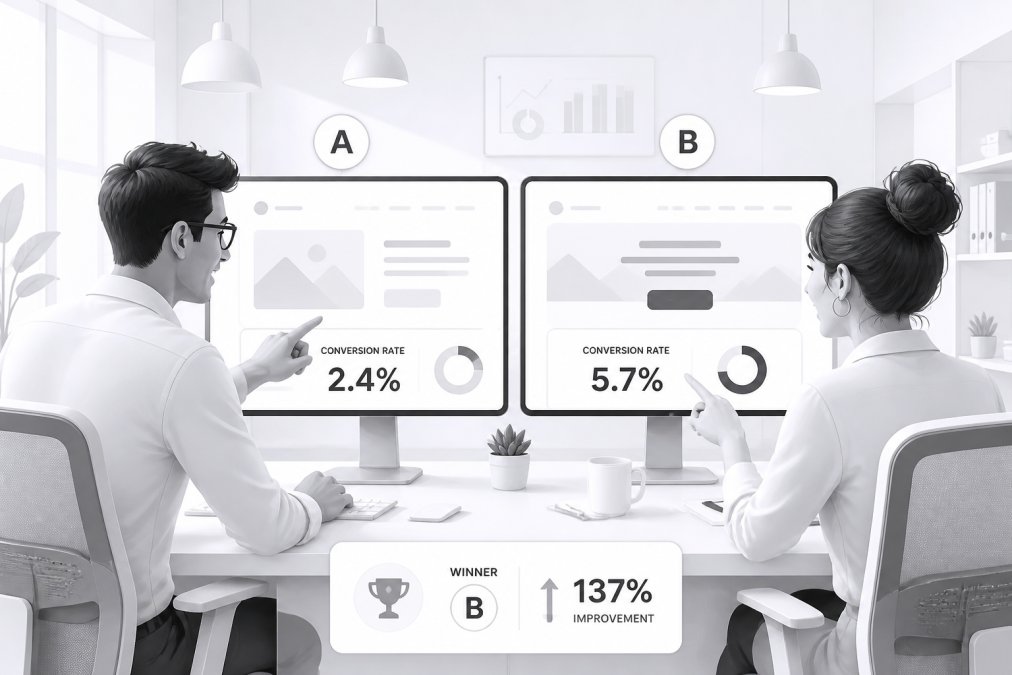
For small businesses with limited traffic:
- Test only one variable at a time: headline, CTA, hero image, or form length
- Run tests for a minimum of two full business cycles (usually two weeks minimum)
- Target pages with at least 500 monthly visitors before running split tests
- Use free or low-cost tools before investing in enterprise platforms
- Document every test result to build institutional knowledge
Organizations using AI-driven experimentation platforms reach valid test results in an average of 14 days, compared to 21 days for traditional tools (Digital Applied, 2026).
AI-Driven Personalization and the New Conversion Frontier
Traffic arriving from AI search platforms converts at 3.49% compared to 2.86% from traditional organic search, a 22% higher conversion rate (Digital Applied, 2026). These visitors arrive with higher intent because AI systems have already pre-qualified their query.
Dynamic content that adapts based on visitor source, location, or behavior is the next layer. A visitor arriving from a paid ad about e-commerce should land on a different version of your homepage than someone who found you through a blog post about website security. Personalized landing pages and CTAs convert up to 202% higher than generic versions.
How to Improve Website Conversion Rates: A Prioritized Action Plan
Priorities depend on where your funnel is breaking. Use this framework to find that quickly:
| Symptom | Root Cause | First Action |
|---|---|---|
| High bounce rate on landing pages | Weak value proposition or slow load | Rewrite headline; run PageSpeed test |
| Good traffic, low form completions | Form friction | Remove fields; add multi-step flow |
| Mobile traffic not converting | Checkout or UX friction on mobile | Full mobile checkout audit |
| Low trust, high exit on product pages | Missing social proof | Add reviews and trust badges near CTA |
| Inconclusive A/B tests | Insufficient traffic or test duration | Extend test window; consolidate traffic |
| Average performance across the board | No structured CRO program | Implement heatmaps; start session recording |
The 3M case study is instructive. Their cross-functional CRO team conducted a comprehensive audit, user behavior research, and A/B testing across multiple business units, achieving a 50% improvement in site conversion rates within 12 months. The method was structured and systematic, not a collection of random tactics.
Start with your analytics. Identify the three pages with the highest traffic and lowest conversion rates. Fix the obvious friction on each, run a test, measure the result, and move to the next. That cycle, repeated consistently, separates the 11.45% performers from the 2.35% median. According to Invesp’s research on structured CRO programs, companies with a structured approach to optimization are twice as likely to see a large increase in sales.
A common mistake is running CRO tactics in isolation without a measurement baseline. If you do not know your current conversion rate by traffic source, device type, and page, you cannot know whether your changes helped or hurt. Set up conversion tracking in Google Analytics before making any changes.
Stagnant website conversion rates are rarely a traffic problem. They are a friction, trust, and clarity problem, and fixing them requires a systematic approach rather than one-off changes. Designworks NW, LLC has spent over 19 years building and optimizing WordPress websites for small businesses, with more than 3,750 completed projects that prioritize performance alongside design. From mobile-optimized checkout flows to page speed improvements and landing page rebuilds, the team handles the technical and strategic work so you can focus on running your business. Get started with Designworks NW, LLC and turn your existing traffic into measurable revenue growth.
Frequently Asked Questions
What is considered a good website conversion rate?
The median website conversion rate sits at 2.35%, according to Digital Applied's 2026 benchmark report. Most industries average between 2.5% and 3.3%. A rate above 5% is strong, and top-performing sites reach 11.45%. Rather than chasing a single number, compare your rate against your own industry benchmark and track improvement over time. A 2% rate in a high-ticket B2B niche can outperform a 6% rate in a low-margin e-commerce category.
How do you calculate your website conversion rate?
Divide the number of conversions by the total number of visitors, then multiply by 100. For example, if your site gets 5,000 visitors in a month and 150 complete a purchase or form, your conversion rate is 3%. Define what counts as a conversion before you calculate: it could be a sale, a lead form submission, a phone call, or even a micro-conversion like an email signup. Track these separately in your analytics platform for the clearest picture.
How does website speed impact conversion rates?
A 1-second delay in page load time reduces conversions by up to 7%, based on findings from Google and multiple 2026 CRO studies. The damage compounds on mobile: moving load time from one to three seconds raises the chance of a mobile bounce by 32%. Since mobile now accounts for 65% of all website traffic but converts at just 1.82% versus desktop's 3.14%, speed improvements on mobile pages typically deliver the fastest return on any technical optimization effort.
What role does A/B testing play in conversion rate optimization?
A/B testing removes guesswork by showing which version of a page, headline, or CTA actually converts better with your specific audience. Convertcart recorded a 37% win rate across 1,103 client experiments, meaning most tests do not produce a winner, but the ones that do compound over time. AI-driven testing platforms now reach statistical significance in 14 days on average versus 21 days for traditional tools, making regular testing more practical for small businesses with limited traffic.
This article was written using GrandRanker


